e.g. Tata motors, Reliance MF, 500570

Equilateral Enterprises Ltd.

531262  SURINDL   Group (XT)

02 Apr,15:41
32.31 1.79 (5.87%)
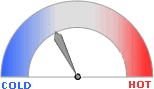
HOW HOT IS THIS STOCK?

Last 15 days data © Rediff.com

Add to Watchlist
 
BSE  |  NSE
zoomZoomRefresh
Day
Wk
Mn
6Mn
Yr
Volume

21,000

Prev close

30.52

Day's H/L (Rs.)

34.29 - 26.50

52wk H/L (Rs.)

32.30 - 20.92

Mkt Cap (Rs. Cr)

39.75

Equilateral Enterprises Ltd.

BUYSELL

Financial Results of Equilateral Enterprises Ltd.

(Rs. Crore)
Mar ' 24Mar ' 23Mar ' 22Mar ' 21Mar ' 20
Sales11.431.726.480.101.60
Operating profit-1.21-1.140.010.07-0.20
Interest-----
Gross profit0.020.020.010.30-
EPS (Rs)0.020.020.010.24-

See More >

Compare 'Equilateral Enterprises Ltd.' with other stocks

  • Balkrishna Industries Ltd.
  • 2,523.45
  • Compare
  • JK Tyre & Industries Ltd.
  • 284.45
  • Compare

Statements:

Balance Sheet  |  P&L  |  Cash Flow  |  Dividend  |  Bonus  |  Share Holding  |  Capital Structures  |  Ratios

Equilateral Enterprises Ltd. PERFORMANCE SNAPSHOT

If you had invested Rs.
in Equilateral Enterprises Ltd.,
  ago

You would have Rs. 1,048.01

Add to Portfolio

Report Card

PE Ratios
1,717.40
EPS (Rs.)
0.02
Sales (Rs. Cr)
7.21
Face Value (Rs.)
10
Net Profit Margin (%)
0.20
Last Bonus
Last Dividend (%)
Return on Average Equity
0.21
Close
Add Equilateral Enterprises Ltd. to your Portfolio


Close
Add Equilateral Enterprises Ltd. to your Watchlist
Alert me if price...
*Watchlist will be based on BSE values
Close

Home

Market News

Latest News

International Markets

Economy

Industries

Mutual Fund News

IPO News

Search News

My Portfolio

My Watchlist

Gainers

Losers

Sectors

Indices

Forex

Mutual Funds

Feedback

Home

Market News

Latest News

International Markets

Economy

Industries

Mutual Fund News

IPO News

Search News

My Portfolio

My Watchlist

Gainers

Losers

Sectors

Indices

Forex

Mutual Funds

Feedback