e.g. Tata motors, Reliance MF, 500570

TCM Ltd.

524156     Group (X)

19 Oct,15:28
46.50 -5.30 (-10.23%)
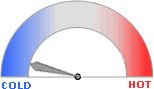
HOW HOT IS THIS STOCK?

Last 15 days data © Rediff.com

 
Get Forecast, Concalls & Announcements on   Screen Now
BSE  |  NSE
zoomZoomRefresh
Day
Wk
Mn
6Mn
Yr
Volume

1,667

Prev close

51.80

Day's H/L (Rs.)

50.60 - 46.50

52wk H/L (Rs.)

81.00 - 36.53

Mkt Cap (Rs. Cr)

34.88

Invest & Trade in on  dhan

TCM Ltd. is not available on NSE (View BSE)

01 Jan,05:30
0.00 0.00 (0.00%)
HOW HOT IS THIS STOCK?

Last 15 days data © Rediff.com

BSE  |  NSE
ZoomRefresh
Day
Wk
Mn
6Mn
Yr
Volume

0

Prev close

0.00

Day's H/L (Rs.)

0.00 - 0.00

52wk H/L (Rs.)

0.00 - 0.00

Turnover (Rs. Lacs)

0.00

Invest & Trade in on  dhan

Financial Results of TCM Ltd.

(Rs. Crore)
Mar ' 26Mar ' 25Mar ' 24Mar ' 23Mar ' 22
Sales17.2324.7331.657.163.46
Operating profit-2.69-0.92-0.37-2.56-2.33
Interest1.920.590.140.26-
Gross profit-3.313.280.31-2.59-1.45
EPS (Rs)-4.854.210.27-3.70-4.37

See More >

Compare 'TCM Ltd.' with other stocks

  • Pidilite Industries Ltd.
  • 1499
  • Compare
  • Solar Industries India Ltd.
  • 20080
  • Compare
  • Gujarat Fluorochemicals Ltd.
  • 4400.55
  • Compare

Statements:

Balance Sheet  |  P&L  |  Cash Flow  |  Dividend  |  Bonus  |  Share Holding  |  Capital Structures  |  Ratios

TCM Ltd. PERFORMANCE SNAPSHOT

If you had invested Rs.
in TCM Ltd.,
  ago

You would have Rs. 000.00

Add to Portfolio

Report Card

PE Ratios
-9.59
EPS (Rs.)
-4.85
Sales (Rs. Cr)
4.02
Face Value (Rs.)
10
Net Profit Margin (%)
-21.03
Last Bonus
-
Last Dividend (%)
-
Return on Average Equity
-10.59

Frequently Asked Questions

Q: What is the current share price of TCM Ltd.?

A: The current share price of TCM Ltd. is ₹ 46.50 (for BSE as on 19 Oct,15:28). The 52-week range is ₹ 81.00 - 36.53. Prices are updated based on live market data.

Q: What is the market capitalization of TCM Ltd.?

A: TCM Ltd. has a market capitalization of ₹ 34.88 Cr, making it a company.

Q: What is the PE ratio of TCM Ltd.?

A: The Price-to-Earnings (PE) ratio of TCM Ltd. is -9.59, indicating its valuation relative to earnings.

Q: Is TCM Ltd. a good investment?

A: TCM Ltd. is considered based on its financial performance, sector outlook, and market conditions. Investors should evaluate fundamentals and consult financial advisors before investing.

Q: What are the latest financial results of TCM Ltd.?

A: TCM Ltd. has reported its latest annual results with revenue of ₹ 17.23 and net profit/loss of ₹ -3.63.

Close
Add TCM Ltd. to your Portfolio


Close
Add TCM Ltd. to your Watchlist
Alert me if price...
*Watchlist will be based on BSE values
Close

Home

Market News

Latest News

International Markets

Economy

Industries

Mutual Fund News

IPO News

Search News

My Portfolio

My Watchlist

Gainers

Losers

Sectors

Indices

Forex

Mutual Funds

Feedback

Home

Market News

Latest News

International Markets

Economy

Industries

Mutual Fund News

IPO News

Search News

My Portfolio

My Watchlist

Gainers

Losers

Sectors

Indices

Forex

Mutual Funds

Feedback

Set Alerts for TCM Ltd.

Exchange:

LTP: Rs. 46.50     Volume: 1,667

Select Alert Type:

Notify me if PRICE...

Market Alerts

Unsubscribe Add to Watchlist Subscribe
Please wait.. wait
Get notified when real-time stock price hits your set thresholds.
Please wait.. wait
Subscibe for notifications?