e.g. Tata motors, Reliance MF, 500570

TCM Ltd.

524156  TCMLMTD   Group (XT)

22 Jan,13:25
54.00 -1.00 (-1.82%)
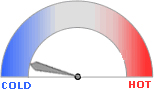
HOW HOT IS THIS STOCK?

Last 15 days data © Rediff.com

Add to Watchlist
 
BSE  |  NSE
zoomZoomRefresh
Day
Wk
Mn
6Mn
Yr
Volume

6,530

Prev close

55.00

Day's H/L (Rs.)

57.00 - 53.05

52wk H/L (Rs.)

81.00 - 35.00

Mkt Cap (Rs. Cr)

40.50

TCM Ltd.

InvestChart

TCM Ltd. is not listed on NSE (View BSE)

Financial Results of TCM Ltd.

(Rs. Crore)
Mar ' 25Mar ' 24Mar ' 23Mar ' 22Mar ' 21
Sales24.7331.657.163.464.25
Operating profit-0.92-0.37-2.56-2.33-0.05
Interest0.590.140.26--
Gross profit3.280.31-2.59-1.451.18
EPS (Rs)4.210.27-3.70-4.372.89

See More >

Compare 'TCM Ltd.' with other stocks

  • Pidilite Industries Ltd.
  • 1,435.40
  • Compare
  • Solar Industries India Ltd.
  • 12,587.65
  • Compare
  • Gujarat Fluorochemicals Ltd.
  • 3,261.30
  • Compare
  • Himadri Speciality Chemical Ltd.
  • 449.45
  • Compare

Statements:

Balance Sheet  |  P&L  |  Cash Flow  |  Dividend  |  Bonus  |  Share Holding  |  Capital Structures  |  Ratios

TCM Ltd. PERFORMANCE SNAPSHOT

If you had invested Rs.
in TCM Ltd.,
  ago

You would have Rs. 000.00

Add to Portfolio

Report Card

PE Ratios
13.06
EPS (Rs.)
4.21
Sales (Rs. Cr)
5.02
Face Value (Rs.)
10
Net Profit Margin (%)
12.73
Last Bonus
Last Dividend (%)
Return on Average Equity
8.32
Close
Add TCM Ltd. to your Portfolio


Close
Add TCM Ltd. to your Watchlist
Alert me if price...
*Watchlist will be based on BSE values
Close

Home

Market News

Latest News

International Markets

Economy

Industries

Mutual Fund News

IPO News

Search News

My Portfolio

My Watchlist

Gainers

Losers

Sectors

Indices

Forex

Mutual Funds

Feedback

Home

Market News

Latest News

International Markets

Economy

Industries

Mutual Fund News

IPO News

Search News

My Portfolio

My Watchlist

Gainers

Losers

Sectors

Indices

Forex

Mutual Funds

Feedback