Refresh
500300 GRASIM Group (A)
Grasim Industries Ltd. LIVE on BSE (View NSE)
Add to watchlist
2338.00
-31.45
-1.33%
| Volume | Prev close | Day's H/L (Rs.) | 52wk H/L (Rs.) | Mkt Cap (Rs. Cr) |
| 15,063 | 2,369.45 | 2,377.70 - 2,328.90 | 2,389.15 - 1,672.09 | 155,243.21 |
|
Day
Wk
Mn
6Mn
Yr
|
HOW HOT IS THIS STOCK? 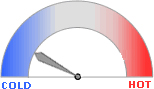 Last 15 days data © Rediff.com |